Pages

2025/01/21

How To Use My Favorite Indicator

This crash course will help with every new trade you make  ‌ ‌ ‌ ‌ ‌ ‌ ‌ ‌ ‌ ‌ ‌ ‌ ‌ ‌ ‌ ‌ ‌ ‌ ‌ ‌ ‌ ‌ ‌ ‌ ‌ ‌ ‌ ‌ ‌ ‌ ‌ ‌ ‌ ‌ ‌ ‌ ‌ ‌ ‌ ‌ ‌ ‌ ‌ ‌ ‌ ‌ ‌ ‌ ‌ ‌ ‌ ‌ ‌ ‌ ‌ ‌ ‌ ‌ ‌ ‌ ‌ ‌ ‌ ‌ ‌ ‌ ‌ ‌ ‌ ‌ ‌ ‌ ‌ ‌ ‌ ‌ ‌ ‌ ‌ ‌ ‌ ‌ ‌ ‌ ‌ ‌ ‌ ‌ ‌ ‌ ‌ ‌ ‌ ‌ ‌ ‌ ‌ ‌ ‌ ‌ ‌ ‌ ‌ ‌ ‌ ‌ ‌ ‌ ‌ ‌ ‌ ‌ ‌ ‌ ‌ ‌ ‌ ‌ ‌ ‌ ‌ ‌ ‌ ‌ ‌ ‌ ‌ ‌ ‌ ‌ ‌ ‌ ‌ ‌ ‌ ‌ ‌ ‌ ‌ ‌ ‌ ‌ ‌ ‌ ‌ ‌ ‌ ‌ ‌ ‌ ‌ ‌ ‌ ‌ ‌ ‌ ‌ ‌ ‌ ‌ ‌ ‌ ‌ ‌ ‌ ‌ ‌ ‌ ‌ ‌ ‌ ‌ ‌ ‌ ‌ ‌ ‌ ‌ ‌ ‌ ‌ ‌ ‌ ‌ ‌ ‌ ‌ ‌ ‌ ‌ ‌ ‌ ‌ ‌ ‌ ‌ ‌ ‌ ‌ ‌ ‌ ‌ ‌ ‌ ‌ ‌ ‌ ‌ ‌ ‌ ‌ ‌ ‌ ‌ ‌ ‌ ‌ ‌ ‌ ‌ ‌ ‌ ‌ ‌ ‌ ‌ ‌ ‌ ‌ ‌ ‌ ‌ ‌ ‌ ‌ ‌ ‌ ‌ ‌ ‌ ‌ ‌ ‌ ‌ ‌ ‌ ‌ ‌ ‌ ‌ ‌ ‌ ‌ ‌ ‌ ‌ ‌ ‌ ‌ ‌ ‌ ‌ ‌ ‌ ‌ ‌ ‌ ‌ ‌ ‌ ‌ ‌ ‌ ‌ ‌ ‌ ‌ ‌ ‌ ‌
Truth and Trends
January 21, 2025

How To Use My Favorite Indicator

Hi Reader,

I’m not a big indicator guy.

I’m sure you’ve seen those charts on X (formerly known as Twitter) or StockTwits – multiple lines hovering over price with rows of nondescript squiggles below. They’re obnoxious, noisy, and make it near impossible to track what matters most: Price!

Instead, I like to keep it simple by applying one versatile tool that I find useful in almost every situation: the Relative Strength Index or RSI.

Today, I’ll share with you the one reason why I prefer the RSI over other technical indicators.

But first, you need to know what the Relative Strength Index is and what it is not…

What It Is and How It Works

Newbie traders often confuse the Relative Strength Index with relative strength analysis (a ratio line comparing two assets). I don’t blame them. The name can be misleading.

But J. Welles Wilder, Jr. created the RSI in the late 70s well before the popularity of relative strength analysis. Instead of identifying the assets outperforming their peers, he wanted to capture the strength of price movements…

The RSI is a momentum indicator that measures the velocity of price swings, up or down, with readings oscillating between 100 and 0. An RSI print greater than 70 is considered overbought, while oversold conditions trigger when it falls below 30. Extreme readings such as these often pinpoint key turning points in the trend.

Most analysts and traders use the Relative Strength Index for signs of exhaustion in buying or selling pressure. Remember, price doesn’t move in a straight line. Uptrends consist of rallies followed by consolidations, and downtrends unfold in a series of selloffs interrupted by brief yet forceful relief rallies.

Unless you’re a value investor or prefer to buy and hold, two components comprise every successful trade: direction and timing. That’s where the RSI comes to your aid…

By applying the momentum oscillator to your trend analysis you can better time your entries and exits. For instance, you’re likely entering at the highs when the RSI reaches overbought or exiting at a critical low when it slips into oversold territory.

That’s why so many traders use the RSI during choppy markets, buying low and selling high as prices mean revert.

But most traders are oblivious to the ways they can use this oscillator to ride the underlying trend…

Bullish or Bearish

I find extreme RSI readings valuable. However, I learned early on that the strongest markets hit overbought and stay overbought.

Plus, the Relative Strength Index oscillates at higher levels during uptrends and lower levels during downtrends, indicating who has control.

(Few traders pay attention to this small detail, but it’s crucial.)

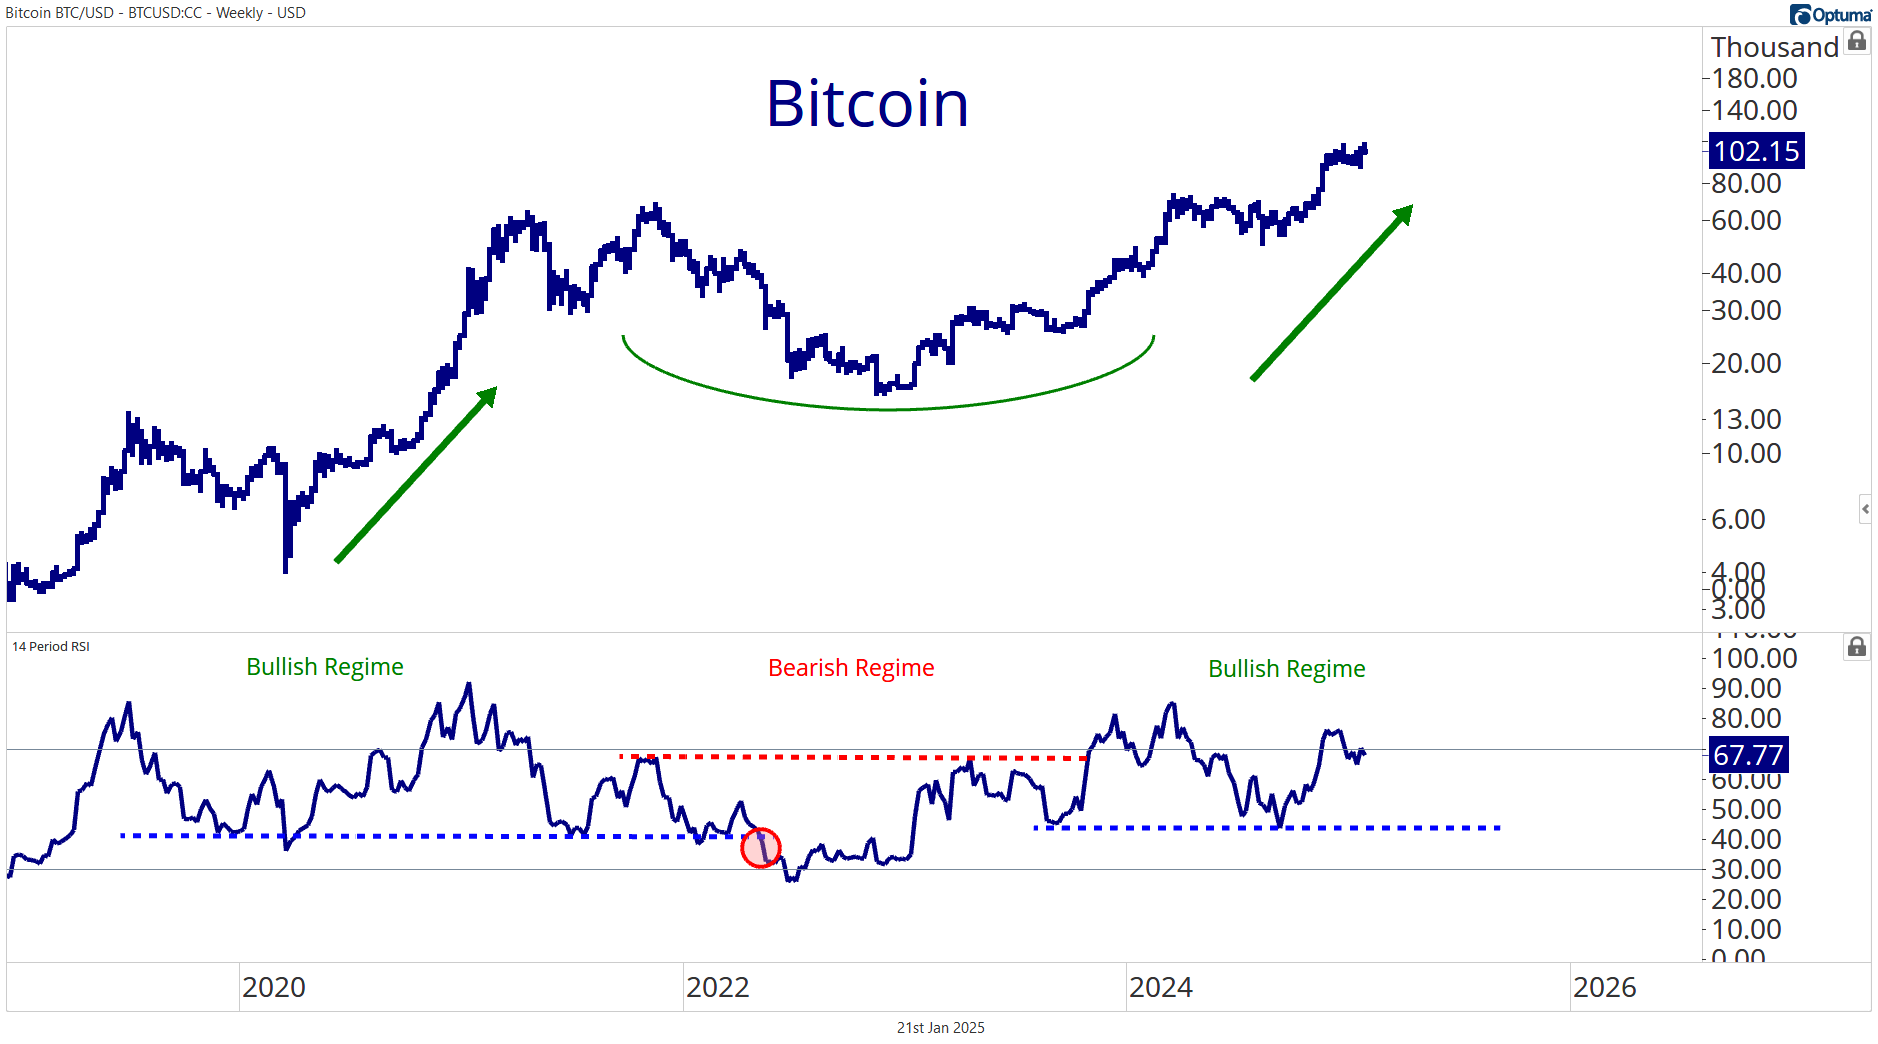
Check out the weekly Bitcoin chart with the 14-week RSI in the lower pane …

Notice how the index churns at higher levels while Bitcoin’s uptrends and at lower levels as the crypto currency corrects. Technical analyst and legendary trader Connie Brown refers to these RSI ranges as momentum regimes.

Despite dropping below 40 for roughly two weeks during the Covid selloff, the 14-week RSI bounced within a bullish momentum regime (between 42 and 85) during the 2020-2021 bull run. For the better part of two years, traders were rewarded for leaning into the uptrend and buying the dip whenever RSI reached 40.

Bitcoin bulls held court.

But that changed after the indicator accompanied Bitcoin to new multi-year lows in spring 2022. The breakdown out of the bullish momentum regime (highlighted in red) confirmed a significant trend reversal was underway and risks were to the downside.

Lo and behold, Bitcoin went on to drop approximately 50% into the fall before posting a cycle low of roughly 15K. Meanwhile, the RSI slipped below 30.

The bears finally had the upper hand.

Buying the dip came with elevated risks until RSI hit 70 and exited the bearish regime in October 2023.

The bulls were now back in the driver seat.

Fast forward to today, and the uptrend remains intact. Bitcoin flirts with new all-time highs. And momentum has yet to dip below 43 since.

Paying close attention to bullish and bearish regimes like these can help you keep your head on straight when planning trades or managing existing positions.

But this is just the tip of the RSI iceberg.

We’ll talk more about other helpful RSI strategies soon!

Happy trading,

Greg Guenthner

Greg Guenthner
Editor, Truth & Trends
AskGreg@paradigmpressgroup.com

BREAKING: Trump’s “Manhattan Project” to Transform U.S. Military

James Altucher

Former CIA advisor, Jim Rickards, predicts President Trump will announce a new “Manhattan Project”...

That will entirely transform our military with super high tech, deadly AI weaponry…

And set off an investing frenzy...

With early investors in the tech companies behind it could see huge gains — up to 16,270% in just 18 months

Don't miss out — discover how to profit now.

Paradigm
© 2025 Paradigm Press, LLC. 1001 Cathedral Street, Baltimore MD 21202. By submitting your email address, you consent to Paradigm Press, LLC. delivering daily email issues and advertisements. To end your Truth & Trends e-mail subscription and associated external offers sent from Truth & Trends, feel free to click here.

Please note: the mailbox associated with this email address is not monitored, so do not reply to this message. We welcome comments or suggestions at AskGreg@paradigmpressgroup.com. This address is for feedback only. For questions about your account or to speak with customer service, contact us here or call (844)-731-0984. Although our employees may answer your general customer service questions, they are not licensed under securities laws to address your particular investment situation. No communication by our employees to you should be deemed as personalized financial advice.

We allow the editors of our publications to recommend securities that they own themselves. However, our policy prohibits editors from exiting a personal trade while the recommendation to subscribers is open. In no circumstance may an editor sell a security before subscribers have a fair opportunity to exit. The length of time an editor must wait after subscribers have been advised to exit a play depends on the type of publication.

All other employees and agents must wait 24 hours after on-line publication or 72 hours after the mailing of a printed-only publication prior to following an initial recommendation. Any investments recommended in this letter should be made only after consulting with your investment advisor and only after reviewing the prospectus or financial statements of the company.

Truth & Trends is committed to protecting and respecting your privacy. We do not rent or share your email address. Please read our Privacy Statement. If you are having trouble receiving your Truth & Trends subscription, you can ensure its arrival in your mailbox by whitelisting Truth & Trends.

Reference Number: 000055791417

No comments:

Post a Comment

Keep a civil tongue.