Hi ,
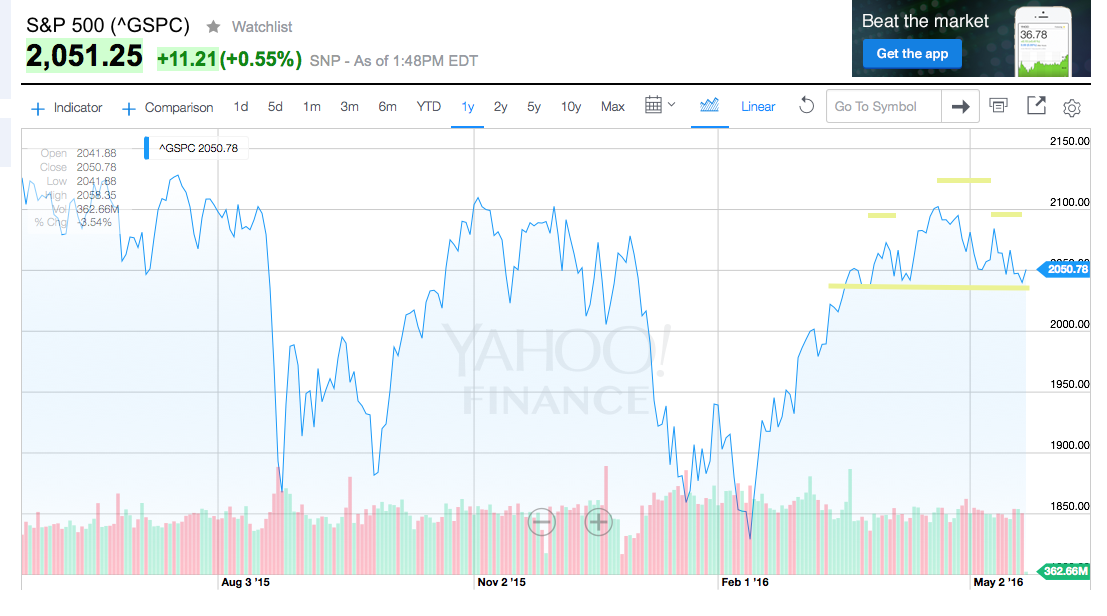
If you're a trader worth his/her salt, you've undoubtedly
noticed the clear and present 'head and shoulders top'
in the S&P Daily Chart.
I've market the chart below ... those light yellow horizontal
lines point out the head at the top, the two dash-shoulders
below (right and left) of the head and then the long neck line....
The Idea, of course is that if the market continues lower and BREAKS
THE NECKLINE you have a big-time short trade on your hands.
Well, this week I talked a little about 'perspective' and in this chart if
you consider the whole chart and not just the right side of the chart,
you'll see that in the center is a big mountain, which we'll call a head..
... and then the two little hills to the right an lift of the mountain...which
we'll call the shoulders.
In this case, we never did get a true breakdown below the neckline.
in fact it could be argued it broke the neck but didn't follow through.
Point being: not all head and shoulder formations lead to the expected
technical conclusion.
So, in this case, it's good to consider other technical factors...
1. In the one year chart above.. each high is lower... so you could
conclude that on a broad perspective, we are a making lower highs
and until we stop that trend, any approach to the last high is a short.
2. What IS a head and shoulder? I mean..what does it mean? If
you look at it, the market makes a high (first shoulder), backs off
and takes out the high, then backs off again way back to the support
of the last back-off and then rallies but does not take out the previous
high (the head). The failure to do that creates a negative environment.
3. The TIME cycle on this chart. Look at the nice big-hill then drop,
then big hill then drop and then (now, the current) big-hill. With each
hill-top almost perfectly equi-distant from the other. This signals
a high probability of another drop.
OK.. so where are we REALLY?
I think can probe the short side BEFORE you break if for biggest potential
gain and rely heavily on the time cycle for your success.
OR, do what I did, and short at the break of the neckline (which
it did yesterday). I'm paying for it today, as the market bounced back,
but I'm confident that the timing cycle and the head and shoulder nature
of this trade will lead me to success if I'm patient.
I chose just above last Monday's high (2079.95) as a stop so
we are talking a WIIIIIIDE stop. So I want very small until the
breakdown is confirmed at which time I'll add.
Wish me luck as I wish YOU luck... and remember...
Luck comes to those traders who are disciplined!
Have a great weekend.
PS: This is the last weekend I'll be offering my Forensic
Look at my $22,500 winner in soybeans. It's a $36 risk
for you and your upside is unlimited. :) TAP HERE
My best,
Norman Hallett, CEO
The Disciplined Trader
The Disciplined Trader, 6606 NW 66th Avenue, Parkland 33067


No comments:
Post a Comment
Keep a civil tongue.