

| Unsubscribe |
I spent 25 years at Merrill Lynch and Vanguard watching the same play run, week after week, in every market condition imaginable.
Bull markets. Bear markets. The sideways chop that drives every trader crazy.
It didn’t matter. The money kept coming in on every trade.
Now that I’m on the outside, I’ve put together a free guide that breaks down exactly how this works, in plain English, no jargon, no finance degree required.
It’s called the Rapid Retirement Guide, and it covers the simple weekly options technique that institutional desks have used for decades to generate consistent income from the market regardless of direction.
What you’ll discover inside:
- Why most investors looking for retirement income are actually trading on the wrong side of the market... and the simple shift that puts you on equal footing with the "smart money"
- The four principles that guide every trade I make. You’re getting the exact framework I refined over 25 years at Merrill Lynch and Vanguard, in plain English. If you’re playing catch-up, this could shave YEARS off your retirement date!
- The incredible win rate behind this approach. You’ll see why it works more often than not, in up, down, and even sideways markets. And discover how using it could change what you consider a comfortable retirement, for good.
- How weekly options work, along with the pro trading technique quietly used for decades to generate income in every market condition.
All laid out so simply, it could be put in action on your next trade.
Click here to get your free copy of the Rapid Retirement Guide.
Good Trading,
Dave Aquino
Base Camp Trading
Costco’s Cooling Comp Sales Keep Stock Stuck in Neutral for Now
Written by Dan Schmidt. Originally Published: 7/20/2026.

Key Points
- Costco's June comparable sales decelerated from May as fading gas price tailwinds and weakening international, especially Canadian, comps offset strong headline net sales growth.
- Costco trades at roughly 46 times forward earnings, more than double the retail sector average, making the stock vulnerable to any slowdown in comp sales growth.
- Costco shares have fallen about 15% from their all-time high and now show bearish technical signals, though long-term fundamentals like renewal rates remain strong.
- Special Report: The company SpaceX cannot operate without
Costco Wholesale Club Inc. (NASDAQ: COST) recently reported its June sales numbers, and at first glance, it looks like another strong month of growth for the country’s premier wholesale club.
However, the stock’s muted reaction shows just how much scrutiny the company is under.
Hidden on Tesla's filing: A $12 billion "super startup" (Ad)
Tesla's most recent SEC filing contains a single line showing $12 billion in revenue from a new venture Elon Musk has been quietly building inside the company — one that has nothing to do with cars, robots, space, or AI.
Blackstone calls the underlying opportunity a $23 trillion market. On July 22, Elon is expected to go public with it. Former hedge fund manager Adam O'Dell says he already knows what's coming — and is sharing the name and ticker of one of his top picks to play it, free.
Watch Adam O'Dell's full briefing and claim your free ticker nowWhen your multiple looks more like a tech sector growth darling than a big-box retailer, “good” simply isn’t good enough.
And when you dig beneath the surface, the latest sales numbers highlight an unsettling trend.
Strong Headline Numbers Obfuscate Underlying Weakness
Costco released its comp sales figures for June, and it’s a print that many other retailers would envy. Net sales for the period totaled $29.24 billion, up 10.6% year-over-year (YOY) and 7.6% excluding gas and currency effects. The board also declared a $1.47-per-share dividend, payable in August with a record date of July 24. But despite these strong headline numbers, weakness is building beneath the surface.
Gas price volatility was a major tailwind for Costco as weary consumers turned to wholesale clubs for relief at the pump. Costco typically prices its gas below retail to drive volume and bring more shoppers into its stores, effectively using it as a loss leader. But now that gas prices are falling again, that tailwind is fading, and the June sales print tells the story. Excluding gas and currency, the 7.6% U.S. comp number is a sharp deceleration from May’s 8.7% comps ex-gas and currency. The total decline is even steeper: 8.8% in June versus 12.5% in May, highlighting just how much fuel prices drove the advance.
U.S. stores may still be in decent shape, but the international market is becoming a growing concern. Canadian adjusted comps fell again, from 7.6% in April to 5.6% in May to 4.9% in June, and total international adjusted comps slipped from 8.0% in May to 7.0% in June. Soft international results could limit upside if U.S. comps reaccelerate now that fighting has resumed in Iran and gas prices are once again moving higher.
Stock Still Trades at Extreme Valuation Compared to Other Retailers
Costco remains an excellent business with a loyal membership base, strong overall sales growth, and a hot dog-and-soda combo that still costs just $1.50. But the stock has long been priced for near-perfect execution, and when you trade at 46 times forward earnings with a Price/Earnings Growth (PEG) ratio approaching 4.5, investors take notice of even the smallest crack in the armor.
The retail sector trades at about 21 times earnings, less than half Costco’s current valuation. While a company with Costco’s sales and membership strength deserves a premium multiple, trading at more than twice the industry average while comp sales are slowing is a blazing red flag that even a FIFA referee could see.
Prominent retailers like Walmart Inc. (NASDAQ: WMT) and Target Inc. (NYSE: TGT) trade at 40 and 18 times earnings, respectively, both well below Costco’s valuation. Even a direct competitor like BJ’s Wholesale Club Holdings Inc. (NYSE: BJ) trades at 21 times earnings and 0.55 times sales.
Here’s a useful way to frame the new narrative shaping retail: the market is no longer focused on premium compounders like COST (up nearly 9% year-to-date), but on cheap laggards like TGT, which is up more than 40% so far in 2026.
Technical Collapse Brings Shares Down With It
Costco’s fundamentals remain strong despite the sales slowdown, but the troubling technicals are now showing up clearly. The stock briefly surged to a new all-time high in May following gasoline shocks tied to the Iran war, as new members flocked to stores after filling their tanks with cheap fuel. But once war hostilities faded, so did the rally in COST shares. The stock has pulled back roughly 15% from its previous all-time high, and the technical signals beneath the surface do not point to a rebound anytime soon.
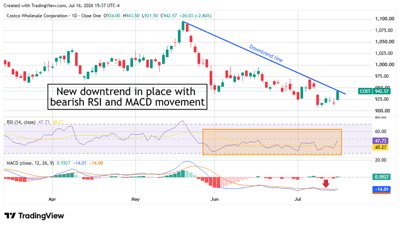
Shares now trade below the 50-day and 200-day moving averages, and the Relative Strength Index (RSI) has been firmly in bearish territory since the end of May. The Moving Average Convergence Divergence (MACD) indicator also shows downward momentum continuing to build.
For long-term investors, this is likely not the time to sell, as the company still has 92% renewal rates and digitally enabled comps remain a bright spot at 21%. But new investors are probably better served waiting for a more attractive entry point. A deceleration doesn’t mean deterioration, but a stock trading at 46 times earnings can’t afford even a brief slowdown if it wants to keep bullish momentum alive.
One Short- and One Long-Term ETF for Quantum Computing Bulls
Written by Nathan Reiff. Originally Published: 7/13/2026.

Key Points
- Pure-play quantum computing stocks like D-Wave Quantum and IonQ have declined sharply this year, even as broader enthusiasm for the sector remains strong.
- The WisdomTree Quantum Computing Fund offers a narrow, less liquid basket of quantum-focused companies suited to long-term, higher-risk investors.
- The Defiance Quantum ETF diversifies into machine learning and AI holdings, providing greater liquidity and stronger year-to-date returns for shorter-term investors.
- Special Report: The company SpaceX cannot operate without
Share declines among companies focused exclusively on quantum computing have been significant this year—D-Wave Quantum Inc. (NYSE: QBTS), for example, is down a dismal 23% year-to-date (YTD), while even better-performing rivals like IonQ Inc. (NYSE: IONQ) are still down 5%. A perfect storm of threats from larger rivals (and up-and-coming new names), continued struggles with marketability and profitability, and uneven revenue performance have prompted many companies in the space to slump.
That isn't to say quantum computing as a sector is dead. In fact, enthusiasm for the industry may be as high as ever, thanks to cash inflows from the federal government and renewed attention from major tech firms. The big issue for many investors is timing—quantum computing may still be years away from becoming widespread and lucrative.
A 17-year investing experiment investigated in Dublin (Ad)
Porter Stansberry flew the Porter and Co. team 3,300 miles to Dublin to investigate a 17-year investing experiment called Project Prophet - and documented everything on film.
Rooted in the laws of physics, this quantitative approach challenges conventional wealth-building wisdom. With 17 years of verified data behind it, Porter calls it unlike anything he has seen in nearly 30 years in the business.
Watch the full investigation and decide for yourselfThat is why investors seeking broad-based quantum exchange-traded funds (ETFs) to access the industry need to consider their time horizon. Fortunately, funds exist for both long- and short-term investors.
A Long-Term Candidate: WQTM
For investors considering quantum as a buy-and-hold or other long-term strategy, an ETF like the WisdomTree Quantum Computing Fund (BATS: WQTM) may be a good place to start. WQTM only launched in the fall of 2025, making it one of the newer tech funds available to investors. It has a narrow focus on quantum computing, with a basket of fewer than 50 companies dedicated to the technology.
That focus is precisely what makes WQTM a candidate for investors with longer time horizons. While WQTM does hold several larger tech firms, including Dell Technologies Inc. (NYSE: DELL) and Intel Corp. (NASDAQ: INTC), it primarily targets companies directly involved in developing quantum technology. Investors should therefore expect volatility in these constituent stocks—and in WQTM—as the industry continues to grow.
Another reason WQTM may appeal to traders planning to hold is that it is not the most liquid tech fund available. It has about a third of a billion dollars in managed assets and a one-month average trading volume below 500,000 shares. Neither figure is tiny, but broader tech funds are available with much larger asset bases and trading volumes for investors more focused on liquidity.
With an expense ratio of 0.45%, WQTM sits in the middle of the pack for niche tech-sector funds, though it is more expensive than many investors will want in the broader ETF market. It may be an option for investors with a higher risk tolerance, or for those who believe it will continue to outperform—it currently boasts YTD returns above 30%.
Notably, the fund may have been boosted by holdings with broader roles in the tech space beyond quantum computing.
A Shorter-Term Play: QTUM
The ups and downs of the quantum space in its earlier stages can create opportunities for short-term wins for investors willing to take the risk. The Defiance Quantum ETF (NASDAQ: QTUM) has performed quite well, with 38% YTD returns despite sector-wide volatility, making it an attractive option for investors seeking quick gains.
One reason QTUM's performance has diverged from the share-price declines of individual quantum companies is that it also focuses on machine learning companies. The fund provides access to quantum firms, yes, but also to makers of embedded AI chips and software firms building tools for data management, perception, and more. With 86 holdings, QTUM has a broader basket than WQTM but still represents just a small slice of the tech space overall.
QTUM also places greater emphasis on equal weighting than WQTM. No single position accounts for more than about 2.4% of the portfolio, which may help the fund capture upside when it is available and cushion some of the declines.
The fund's $5.4 billion managed asset base and one-month average trading volume above 540,000 shares also support a stronger liquidity case than WQTM, although it is far from the largest or most heavily traded tech fund. Part of that advantage may stem from its lower expense ratio of 0.4%, while performance may also be a factor, as it has solidly outperformed both WQTM and the S&P 500 so far this year. QTUM has been down over the last month amid the industry-wide pullback, showing that it cannot fully escape sector weakness. Still, investors willing to take on the volatility may be well rewarded.
This email communication is a sponsored message for Base Camp Trading, a third-party advertiser of MarketBeat. Why did I receive this email content?.
If you need assistance with your newsletter, feel free to email MarketBeat's U.S. based support team at contact@marketbeat.com.
If you would no longer like to receive promotional emails from MarketBeat advertisers, you can unsubscribe or manage your mailing preferences here.
© 2006-2026 MarketBeat Media, LLC. All rights reserved.
345 North Reid Place, Sixth Floor, Sioux Falls, S.D. 57103. USA..


No comments:
Post a Comment
Keep a civil tongue.